CASE STUDY
Sales Analytics
Transforming transactional sales data into actionable business insights through SQL and interactive Power BI dashboards.
ROLE
Data Analyst & Business Intelligence Developer
PLATFORM
MySQL · Power BI
FOCUS
Business Intelligence · Data Analytics
LIVE
The Real Problem
The business had a full year of sales transactions but lacked a structured way to monitor performance, understand customer purchasing behavior, and identify the products driving revenue. Decision-makers needed an interactive solution that transformed raw sales records into actionable business insights.
The Approach
Build an end-to-end business intelligence solution by querying transactional sales data with SQL, calculating key performance indicators, and designing an interactive Power BI dashboard for real-time business analysis.
The workflow combined data exploration, SQL-based transformations, KPI calculations, trend analysis, and dashboard development to support data-driven decision-making.
What I Built
- Imported and analyzed transactional sales data using MySQL
- Developed SQL queries to calculate business KPIs, sales trends, and product performance metrics
- Performed customer, category, and product-level sales analysis
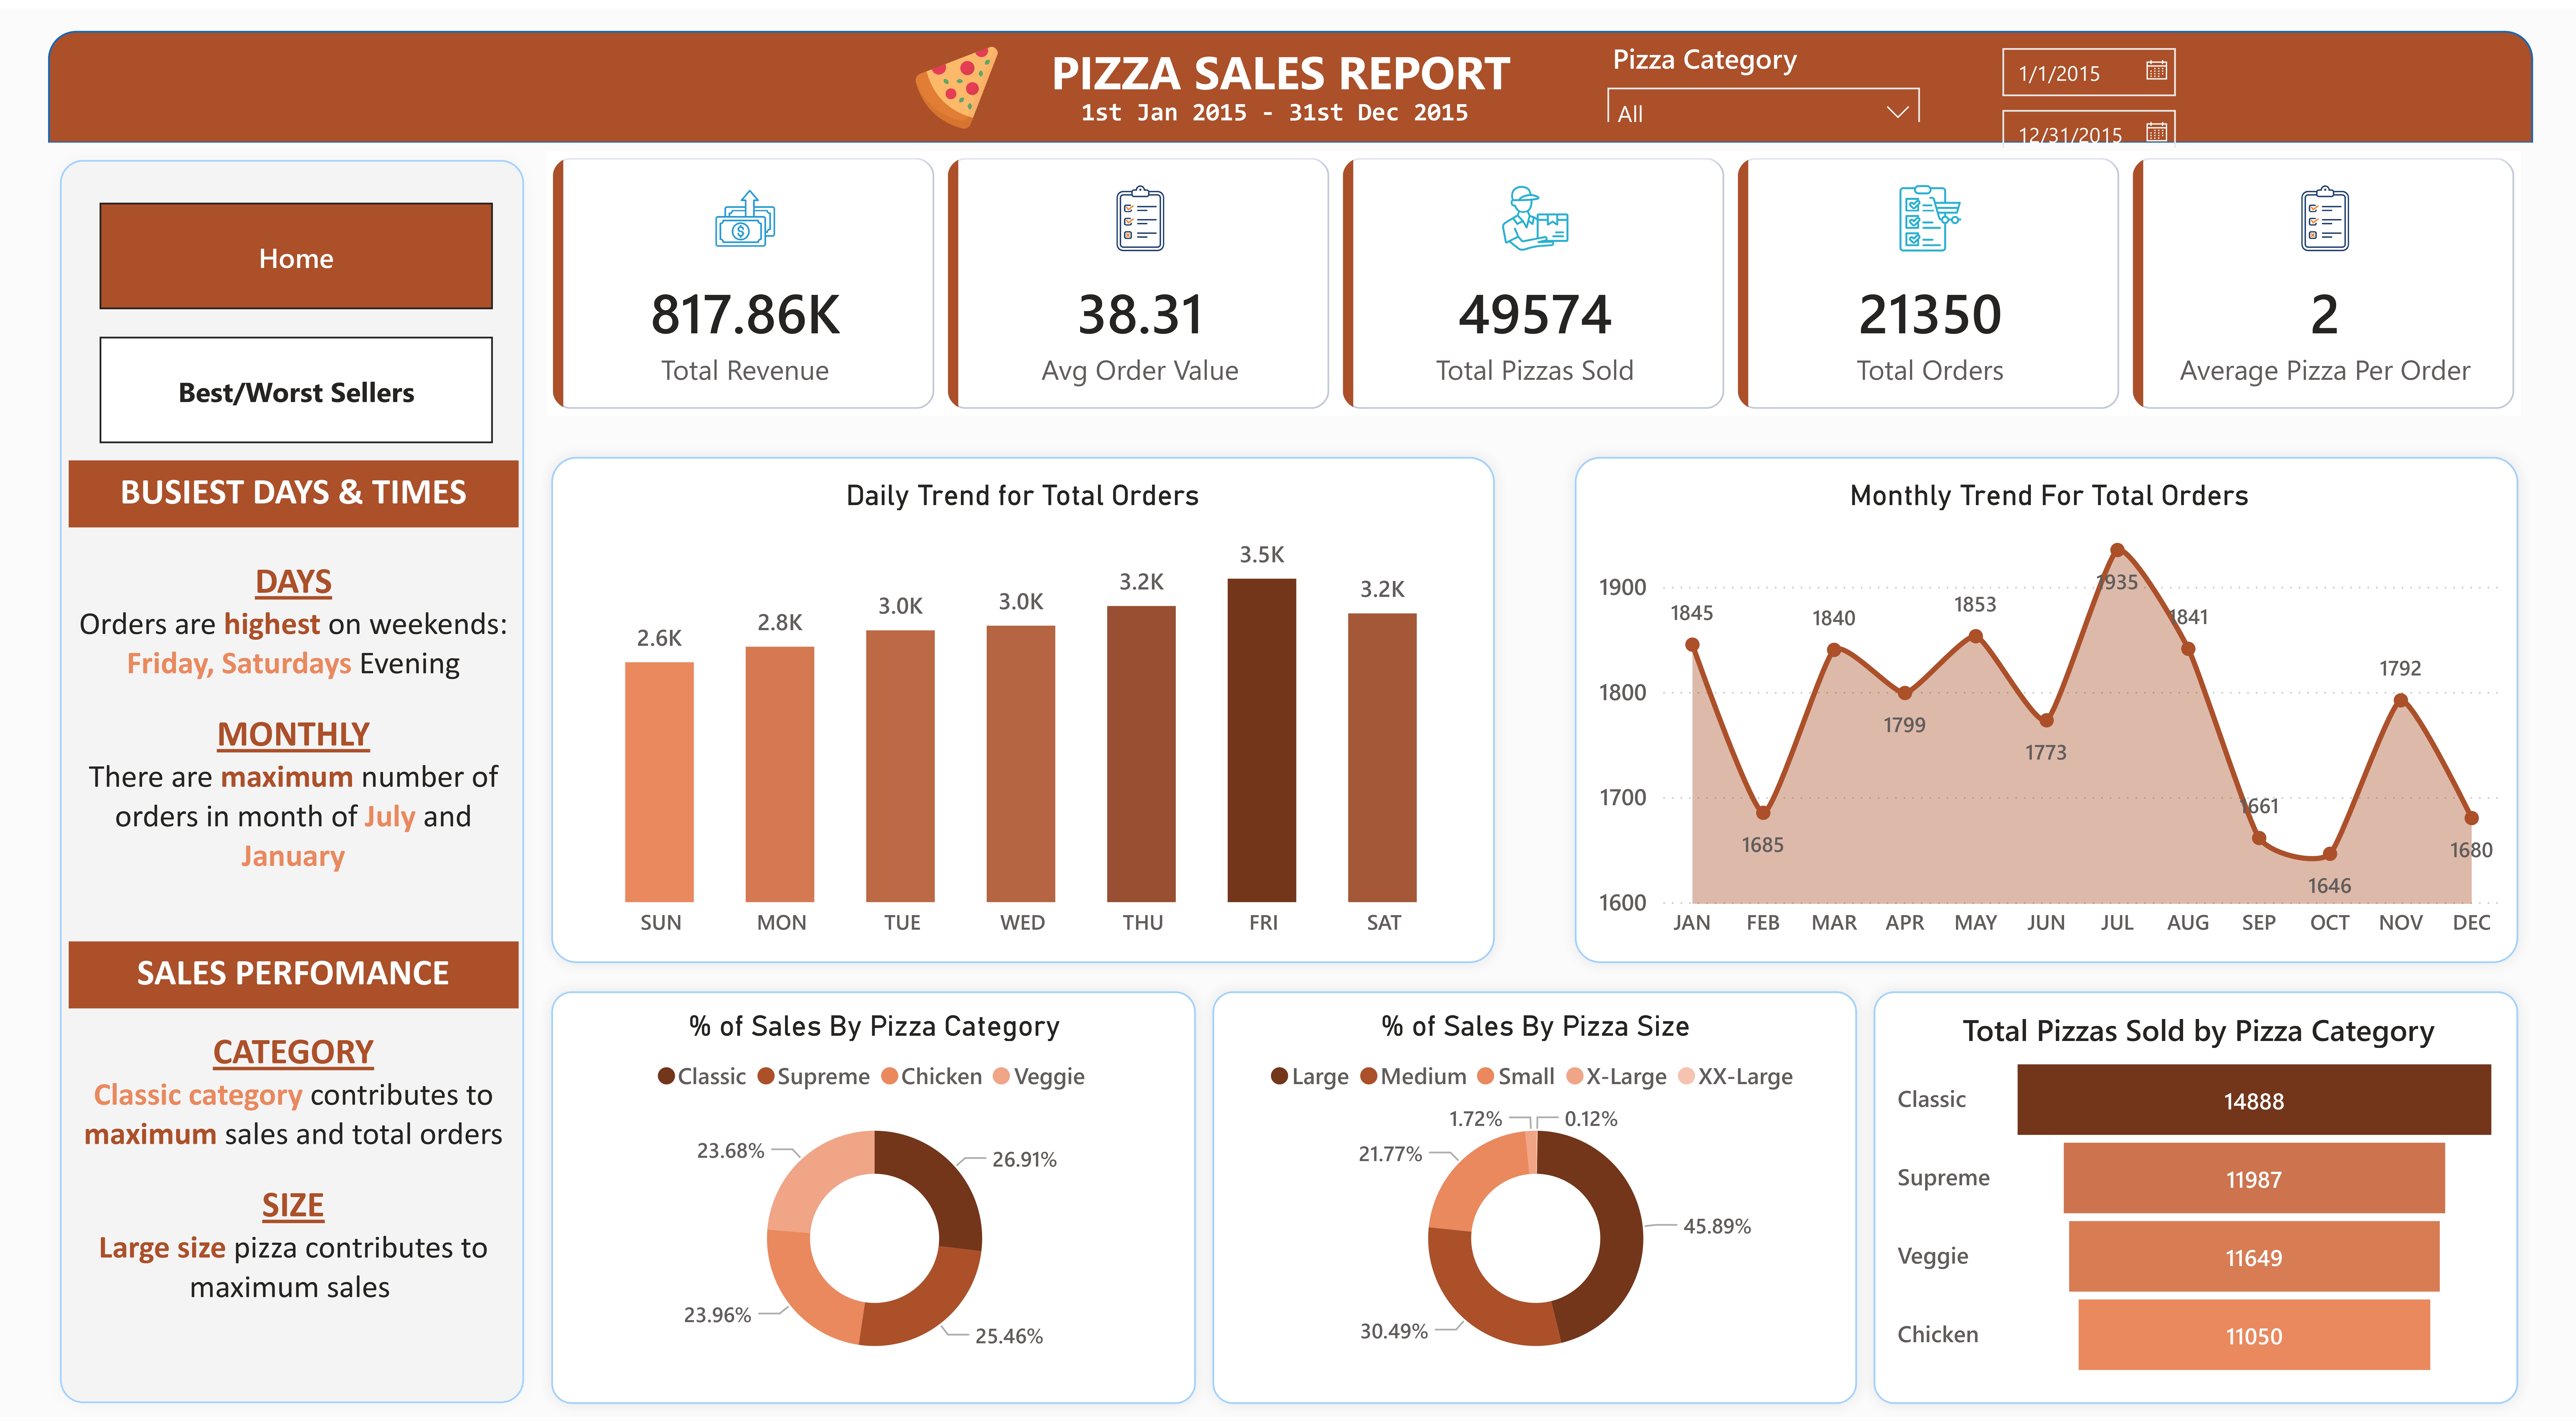
- Designed an interactive Power BI dashboard with KPI cards, filters, and drill-down capabilities
- Created executive-ready reports highlighting sales performance, customer behavior, and best- and worst-performing products
What Changed
- Delivered a centralized dashboard for monitoring business performance
- Identified peak sales periods, customer purchasing trends, and revenue-driving product categories
- Highlighted top- and bottom-performing menu items to support product strategy
- Enabled faster, data-driven business decisions through interactive visual analytics